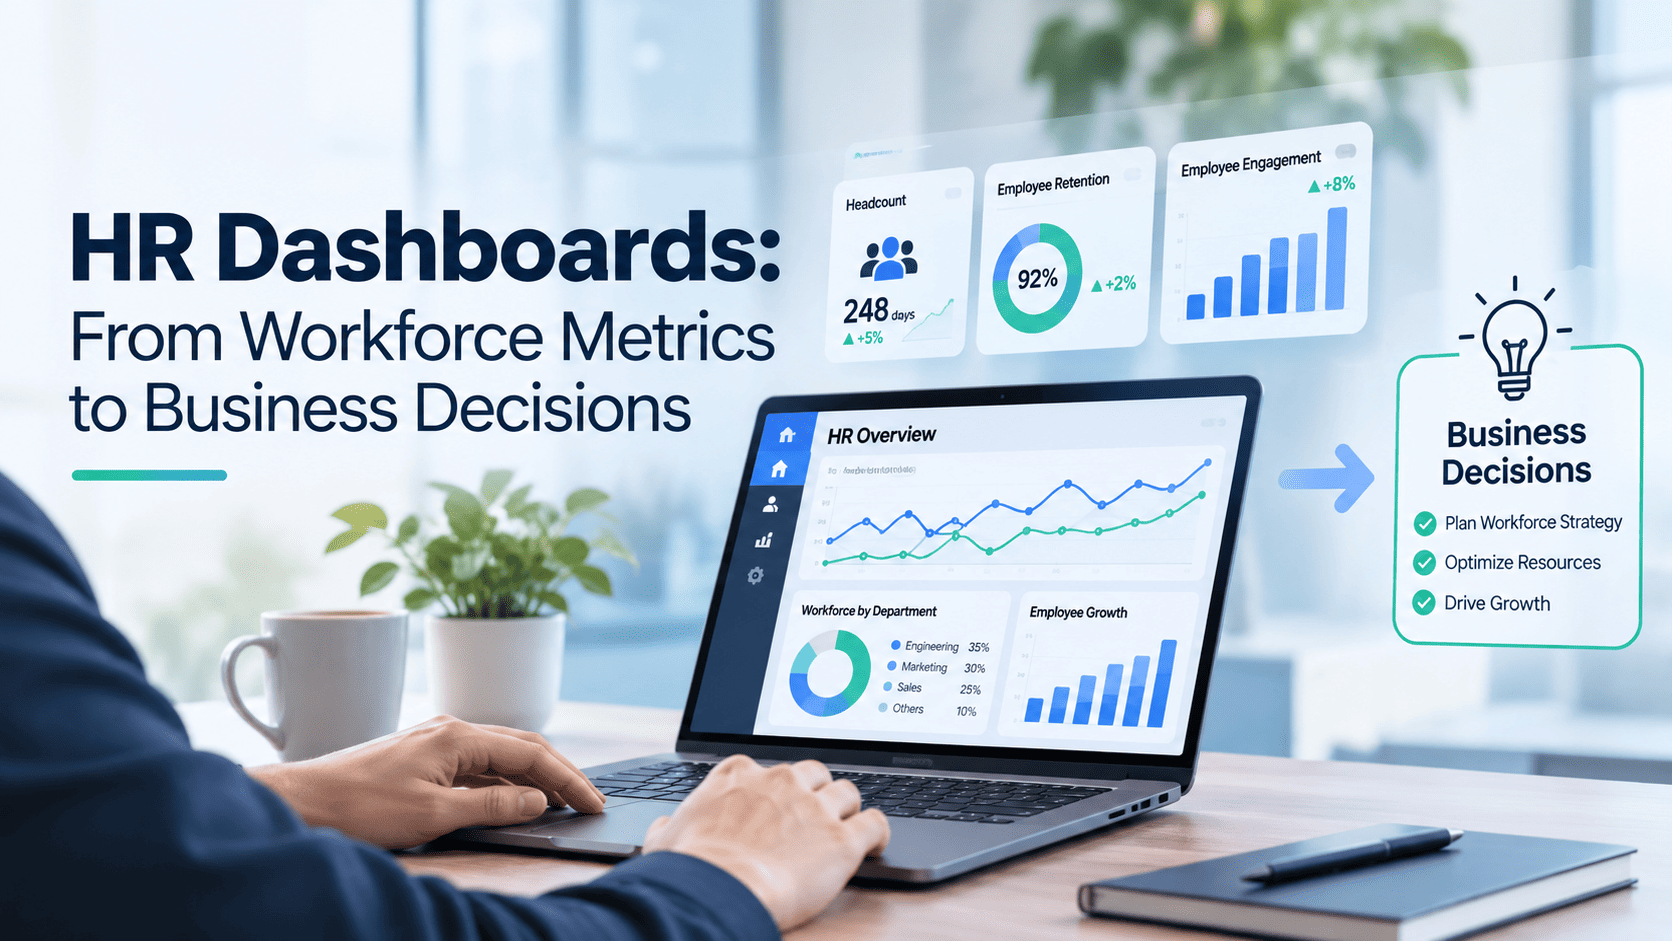
HR Dashboards: When Numbers Begin to Tell the Story of the Business
In management meetings, conversations about people often begin with numbers.
How many employees do we have today? How many joined? How many left? How much are we spending on our workforce?
All of these numbers matter. But as the business moves forward, another question may be even more interesting:
Are the people we have today ready to take the business where it wants to go next?
That simple question changes the way we look at an HR dashboard.
An HR dashboard can do more than bring workforce numbers together. Viewed in the right context, it can help management understand organizational capacity, recognize emerging risks, and assess whether the workforce is ready to support the business’s next priorities.
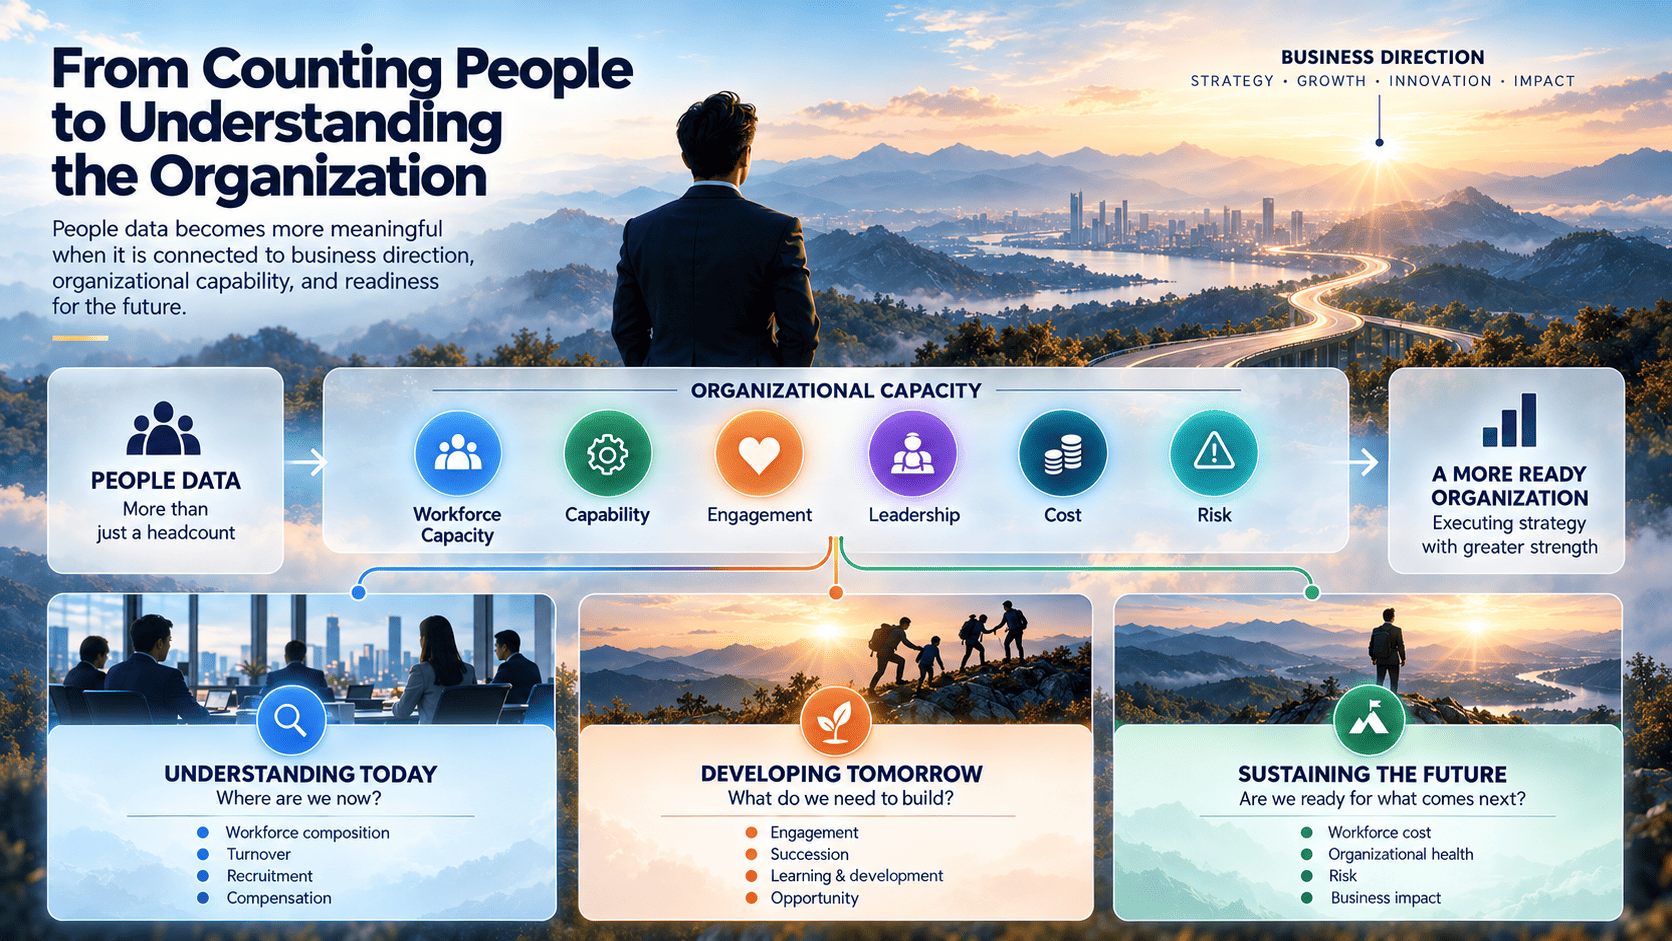
From counting people to understanding the organization
Headcount is an obvious starting point.
But a total number rarely tells the whole story.
One hundred people positioned across the functions the business needs can mean something very different from one hundred people concentrated in areas with sufficient capacity while critical positions remain vacant.
When headcount is viewed together with business unit, location, seniority, employment status, tenure, and organizational needs, the story begins to change.
The question is no longer simply:
“How many people do we have?”
It becomes:
“Do we have the right people where the business needs them most?”
The same is true when we look at turnover.
A turnover rate that appears low overall may not always be good news. The people leaving may be those with capabilities that are difficult to replace.
Departures may be concentrated among employees early in their tenure.
Or most may be coming from one particular function.
The same number can tell a very different story when the context changes.
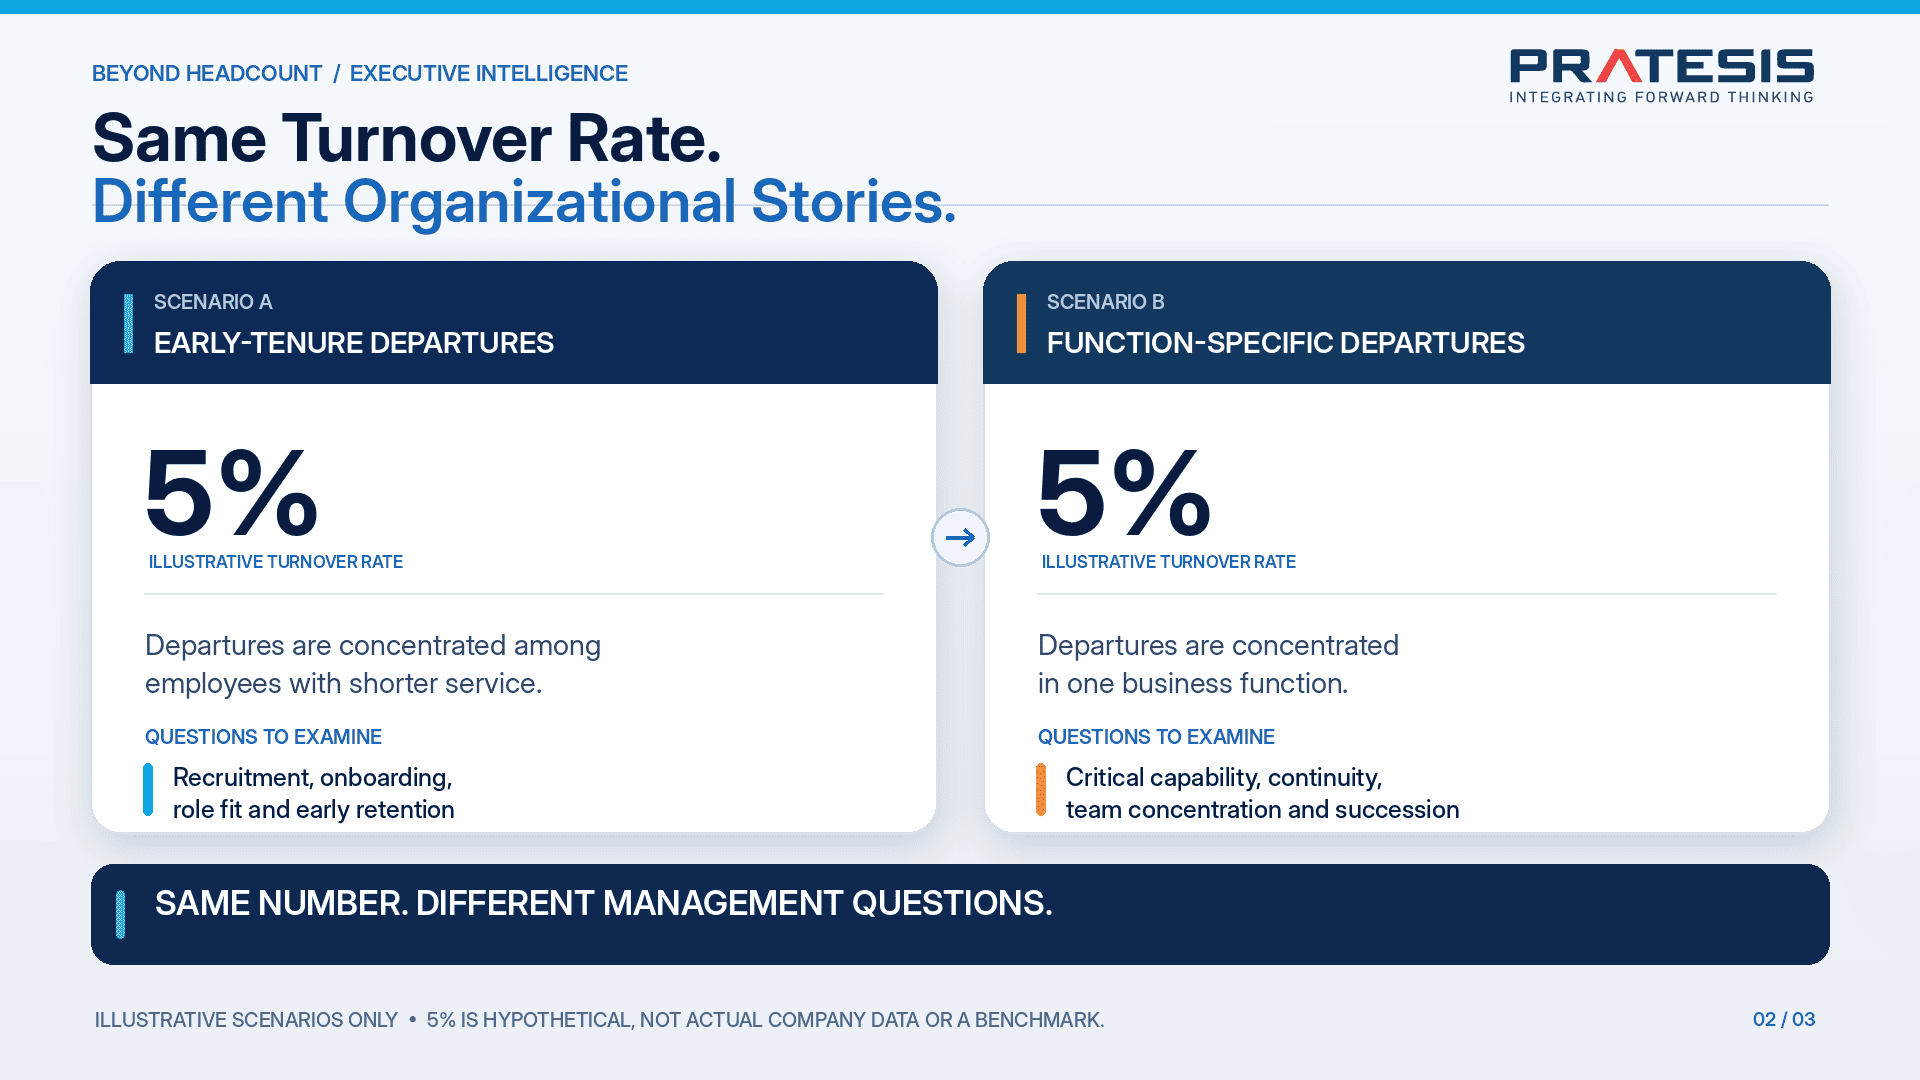
This is why turnover becomes more useful when we look beyond the percentage and ask who is leaving, when they leave, where they work, and what roles they leave behind.
From there, the conversation becomes richer.
Is compensation the issue? The onboarding experience? Leadership? Workload? Or is the movement simply part of a planned organizational change?
Data does not always provide the answer immediately.
But it can help us ask better questions.
Recruitment is about more than speed
The same perspective applies to recruitment.
A shorter time-to-fill can certainly look positive. But filling a position quickly does not necessarily mean the issue has been solved.
Was the right person hired?
Will that person stay?
How quickly can they begin contributing?
And where does the process tend to slow down—candidate sourcing, interviews, approvals, or offers?
When the candidate journey becomes more visible, the recruitment dashboard stops being only a report on HR activity.
It can also reveal where the organization may be losing time, capacity, or opportunity.
Compensation numbers need context
Compensation comparisons can also appear simple when viewed only as numbers.
But differences in pay do not automatically mean unfairness.
Role, responsibility, tenure, performance, and location can all provide important context.
A dashboard can help highlight areas worth examining further—not to make everyone’s compensation identical, but to understand whether differences have a basis that can be explained.
In this sense, data opens the conversation rather than making the final judgement.
There is a story behind employee voice
Employee engagement works in much the same way.
An overall survey score may look healthy. But the average can hide very different experiences across the organization.
One team may feel it has strong opportunities to grow.
Another may be struggling with workload.
Elsewhere, the challenge may be the relationship with managers or a lack of clarity about direction.
Employee voice becomes more useful when the score is read together with the themes behind it.
The question is no longer only:
“What is the score?”
It becomes:
“What are people actually experiencing inside the organization?”
Looking into the future through succession
Some numbers tell us less about today and more about readiness for tomorrow.
Succession readiness is one of them.
A list of potential successors may look reassuring. But a list of names does not necessarily mean the organization is truly prepared.
Do critical roles have successors?
How ready are those candidates?
What still needs to be developed?
Are there roles that depend too heavily on one individual?
Questions such as these move succession beyond talent-pool administration.
They turn it into a conversation about business continuity.
Learning: from activity to capability
The number of training participants and learning hours is easy to measure.
But another question may be more interesting:
What changed after someone learned something new?
Did their capability improve?
Are they more ready to take on broader responsibility?
Is the new knowledge actually being applied at work?
Training volume tells us about activity.
But when learning data is connected with capability development and real work, we begin to see something more meaningful: how an organization is building its ability to perform.
The relationship is not always simple. Performance can be influenced by many factors.
That is precisely why a dashboard should help us see patterns rather than rush to conclusions about cause and effect.
Opportunity is not always visible in overall representation
Workforce diversity also tells a broader story than overall composition alone.
Someone may be represented in the organization, but do they have a similar opportunity to progress?
Do patterns in recruitment continue into promotion?
Is access to development reasonably distributed?
How does representation change as we move into leadership roles?
Questions like these allow the numbers to tell us something about opportunity, not just presence.
From workforce cost to the value being built
Workforce cost is often one of the largest investments an organization makes.
And it involves more than base salary.
Benefits, contractors, outsourcing, recruitment, development, and other investments all form part of the picture.
Comparing actual spending with budget is important.
But the conversation can go a little further:
What capacity and value are we building through that investment?
The purpose is not to reduce people to productivity numbers.
Quite the opposite.
It is to understand whether the organization is providing the capacity, capability, processes, and support that allow people to make their best contribution.
When several numbers begin to speak to each other
Perhaps the most interesting part of a dashboard appears when indicators are no longer viewed in isolation.
Imagine a business unit where absence begins to rise.
At the same time, engagement starts to decline.
Several important employees leave.
Employee concerns increase.
And replacement positions take longer to fill.
None of these numbers alone necessarily explains the cause.
But when they appear together, a pattern begins to emerge.
This is where the dashboard changes from a collection of information into a way of identifying where we may need to look more closely.
Not to label an individual or a business unit.
And not to generate automatic decisions.
But to help the organization recognize signals before they grow into larger issues.
For management, the value lies not in drawing an immediate conclusion, but in knowing where to direct attention. The next step may involve examining workload, reviewing leadership practices, understanding recruitment constraints, or simply asking the people closest to the situation what is happening.
Not everything needs to appear at once
As technology makes more data available, it is easy to be tempted to display everything.
More charts.
More metrics.
A fuller dashboard.
But more information does not always create more clarity.
An organization beginning its HR analytics journey may be better served by starting with its most relevant business issue.
If vacancies are constraining operations, for example, the first view may focus on workforce composition, recruitment flow, and turnover.
As needs evolve and data quality improves, other indicators can be added.
This allows the dashboard to grow with the maturity of the organization rather than becoming a large project that tries to answer everything from day one.
One definition for one conversation
There is another important part of a dashboard that does not always appear on the screen: definitions.
What counts as an “active employee”?
When is someone counted as turnover?
What time period is being measured?
Do Finance, HR, and Operations use the same definition?
These questions may sound simple, but they determine whether a dashboard improves the conversation or simply turns meetings into debates about the numbers.
The quality of a dashboard therefore depends on more than technology.
It also depends on shared definitions of the data being used.
Not every metric needs to be updated continuously either.
The frequency should reflect how the information is used for decisions.
And because workforce information involves people, access to personal data should remain appropriate to roles and responsibilities.
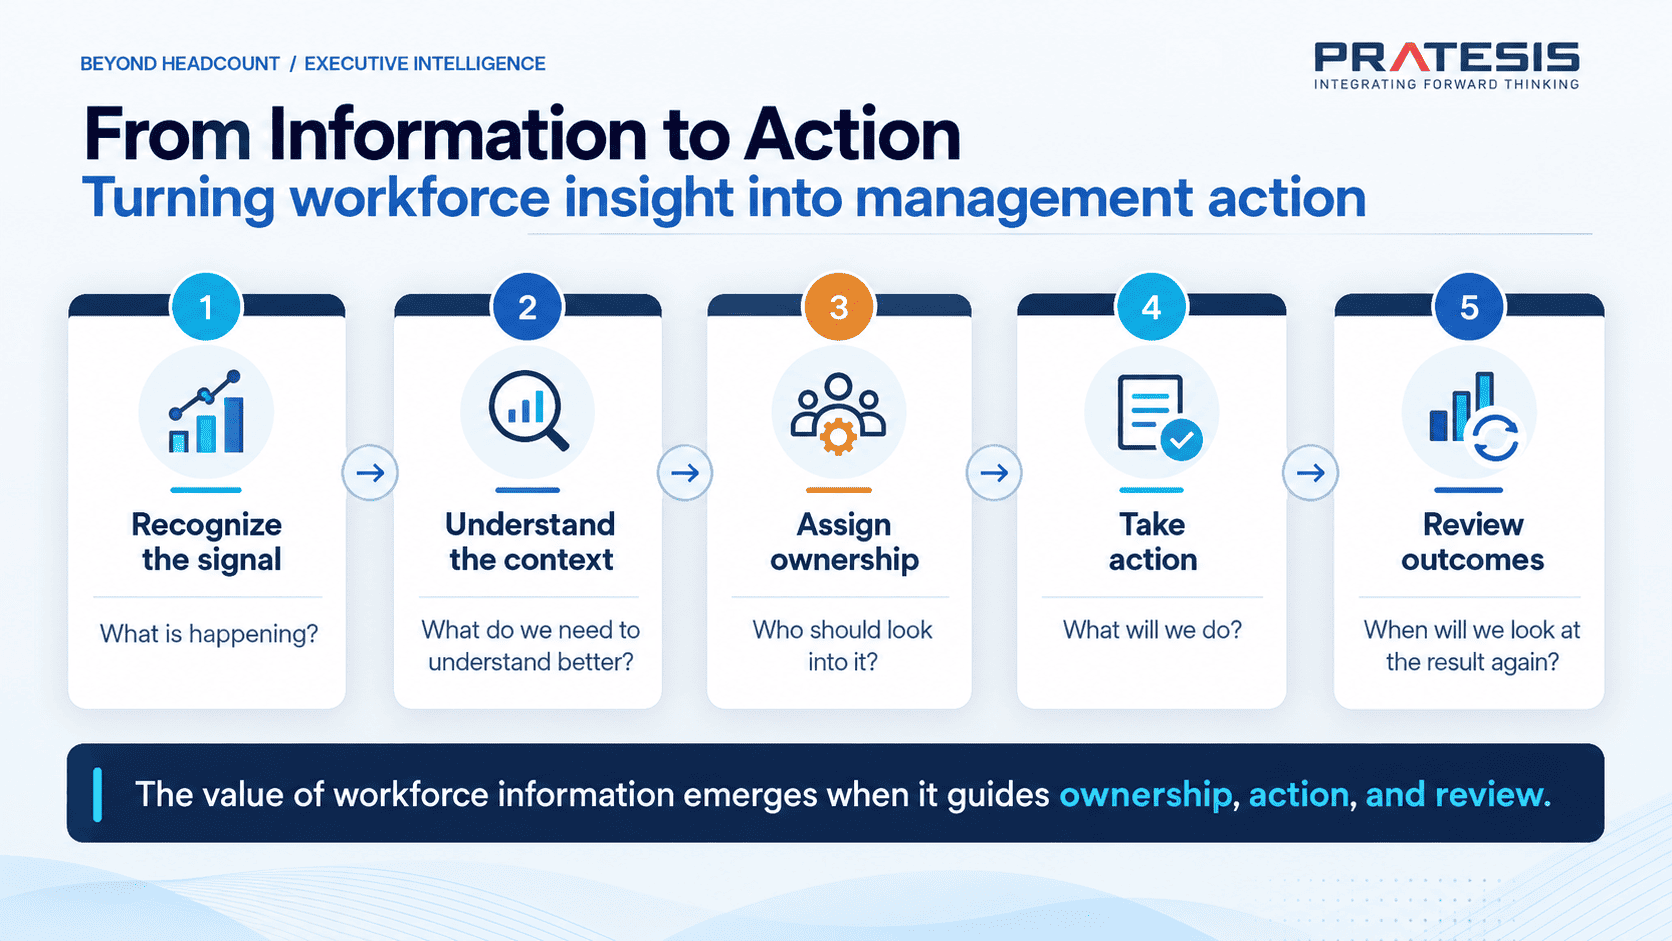
From information to action
Ultimately, technology provides the tools.
The value appears when information becomes connected with ownership and action.
Any indicator that deserves attention can lead us to a few simple questions:
What is happening?
What do we need to understand better?
Who should look into it?
What will we do?
And when will we look at the result again?